Bối cảnh
Trước khi Swift Charts ra đời, việc vẽ biểu đồ trong app iOS/macOS đòi hỏi phải dùng thư viện bên thứ ba như Charts (Daniel Gindi) hoặc tự vẽ thủ công bằng Core Graphics — tốn thời gian và khó bảo trì. Tại WWDC22, Apple đã giới thiệu Swift Charts: một framework native, tích hợp hoàn toàn với SwiftUI, cho phép developer tạo biểu đồ đẹp và tương tác chỉ với vài dòng code.
Sample code "Visualizing Your App's Data" là ứng dụng minh họa chính thức của Apple đi kèm hai session WWDC22: Hello Swift Charts (10136) và Swift Charts: Raise the Bar (10137). Ứng dụng hỗ trợ cả iOS, macOS và watchOS trong cùng một target SwiftUI.
Tại sao quan trọng
- Không cần thư viện bên thứ ba — Swift Charts là framework native từ Apple, được tối ưu về hiệu năng, accessibility và hỗ trợ Dark Mode tự động
- API declarative, dễ học — Cú pháp tương tự SwiftUI: khai báo
Chart,BarMark,LineMark,PointMark... developer quen SwiftUI sẽ cảm thấy quen thuộc ngay - Đa nền tảng thực sự — Cùng một đoạn code chạy được trên iPhone, iPad, Mac và Apple Watch mà không cần điều chỉnh layout
- Tương tác phong phú — Hỗ trợ
chartXSelection,chartOverlayđể làm tooltip, highlight điểm dữ liệu và gesture-driven exploration
Chi tiết kỹ thuật
Cài đặt và chạy thử:
git clone https://github.com/apple-sample-code/VisualizingYourAppsData.git
cd VisualizingYourAppsData
open VisualizingYourAppsData.xcodeproj
Chọn target SwiftChartsExample (iOS/macOS) hoặc SwiftChartsExample Watch App rồi nhấn Run.
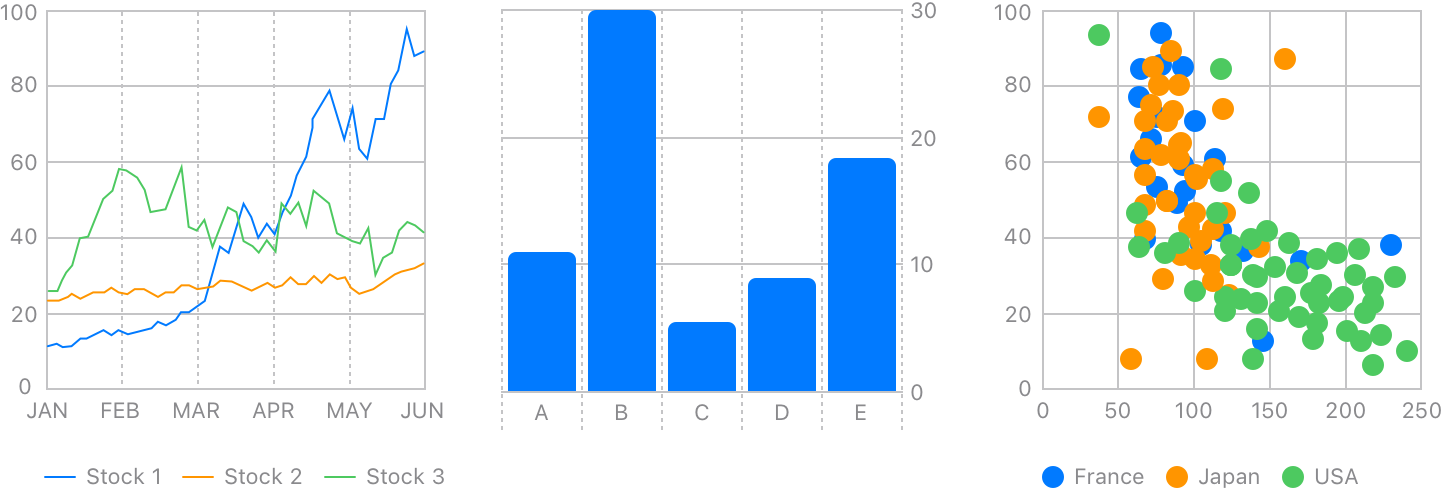
Ví dụ 1 – Bar Chart cơ bản:
import Charts
import SwiftUI
struct SalesData: Identifiable {
    let id = UUID()
    let month: String
    let revenue: Double
}

let data: [SalesData] = [
    .init(month: "T1", revenue: 120),
    .init(month: "T2", revenue: 95),
    .init(month: "T3", revenue: 175),
    .init(month: "T4", revenue: 210),
]

struct RevenueChart: View {
    var body: some View {
        Chart(data) { item in
            BarMark(
                x: .value("Tháng", item.month),
                y: .value("Doanh thu (tr đ)", item.revenue)
            )
            .foregroundStyle(.blue)
        }
        .frame(height: 200)
        .padding()
    }
}
Ví dụ 2 – Line Chart với nhiều series:
Chart {
    ForEach(seriesData) { series in
        ForEach(series.points) { point in
            LineMark(
                x: .value("Ngày", point.date),
                y: .value("Giá trị", point.value)
            )
        }
        .foregroundStyle(by: .value("Loại", series.name))
        .symbol(by: .value("Loại", series.name))
    }
}
.chartLegend(position: .bottom)
Ví dụ 3 – Interactive selection (tooltip):
@State private var selectedDate: Date? = nil
Chart(data) { item in
    LineMark(
        x: .value("Ngày", item.date),
        y: .value("Nhiệt độ", item.temperature)
    )
}
.chartXSelection(value: $selectedDate)
.chartOverlay { proxy in
    GeometryReader { geo in
        if let date = selectedDate,
           let origin = proxy.position(forX: date) {
            let x = origin + geo[proxy.plotAreaFrame].origin.x
            Rectangle()
                .fill(.gray.opacity(0.3))
                .frame(width: 1)
                .offset(x: x)
        }
    }
}
Các loại mark được hỗ trợ:
| Mark | Dùng cho |
|---|---|
BarMark |
Biểu đồ cột / thanh |
LineMark |
Biểu đồ đường |
PointMark |
Biểu đồ phân tán (scatter) |
AreaMark |
Biểu đồ vùng |
RuleMark |
Đường tham chiếu / ngưỡng |
RectangleMark |
Heatmap, biểu đồ Gantt |
Liên kết hữu ích: